...
| Multiexcerpt | ||||
|---|---|---|---|---|
| ||||
## In progress. Waiting for feedback on some calculations ##
| Multiexcerpt | ||
|---|---|---|
| ||
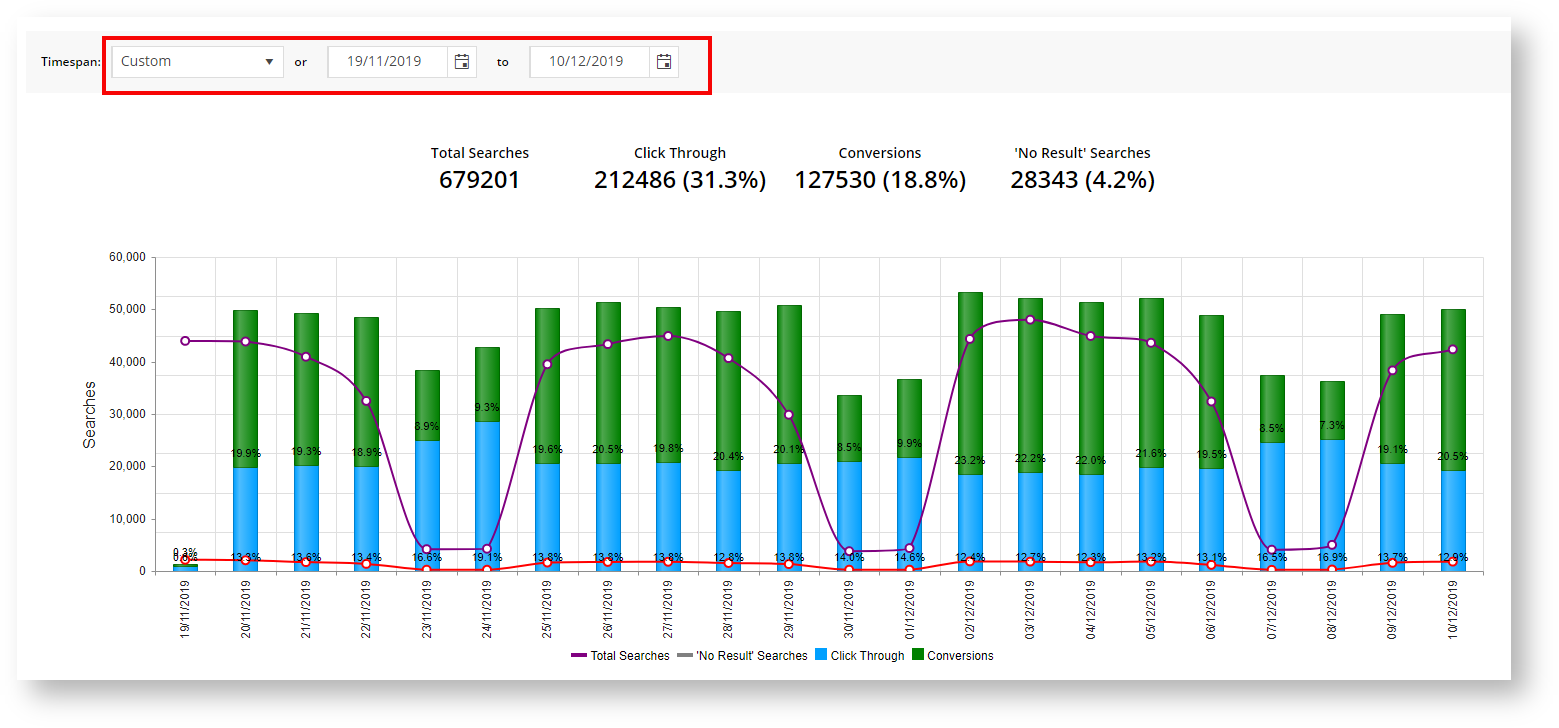
SEARCH ANALYTICS: Capture and analyse the interaction users are having with your site in real-time:
Answer these questions instantly with a quick glance at the Search Analytics Dashboard. |
...
5. What am I looking at here?
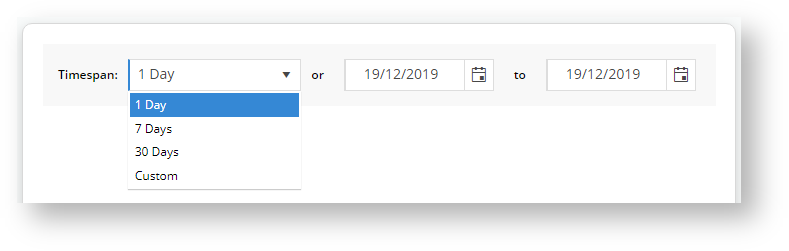
Feature Default Value Description Words mean nothing to me... Timespan 1 Day The period in which you want to display the search analytics.
Other options:
- 7 Days
- 30 Days
- Custom.
When you choose custom, use the calendar from and to dates to set your time range.
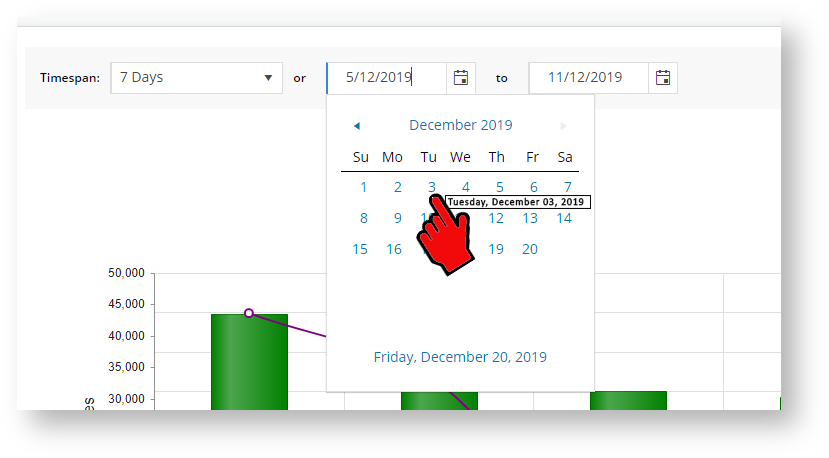
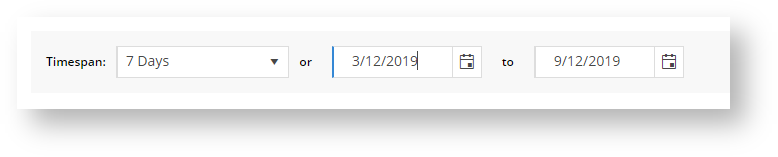
Calendars Current day When you select a start date using the calendar, the end date will automatically adjust based on the Timespan value. For instance, if we have Timespan set to 7 Days and select 3/12/2019 as the start date, then the system will automatically set the end date to 9/12/2019.
To set a display period other than 1 Day, 7 Days, or 30 Days, select the Custom Timespan, then set your start and end dates using the calendar.
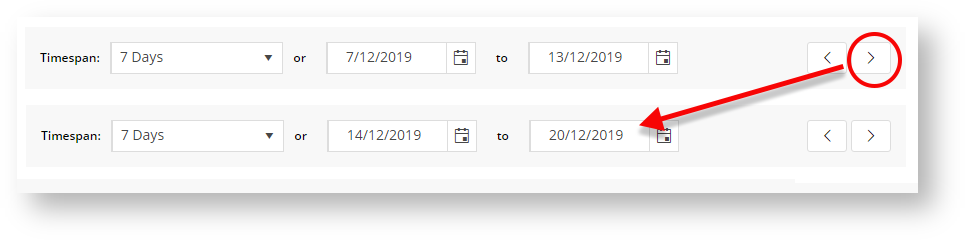
Timespan Arrows Click the left or right arrows to move back and forth by the Timespan period.
For instance, if the Timespan is set to 7 days and you are viewing data for the week 7/12/2019 to 13/12/2019, then when you click the right arrow ( > ), the system will skip to the next week, displaying analytical data for the 7 days between 14/12/2019 and 20/12/2019.
Horizontal Axis Hourly from midnight The horizontal axis displays the timespan values and changes depending on the Timespan value selected.
When timespan = 1 Day, the horizontal axis displays every hour from midnight until the current hour.
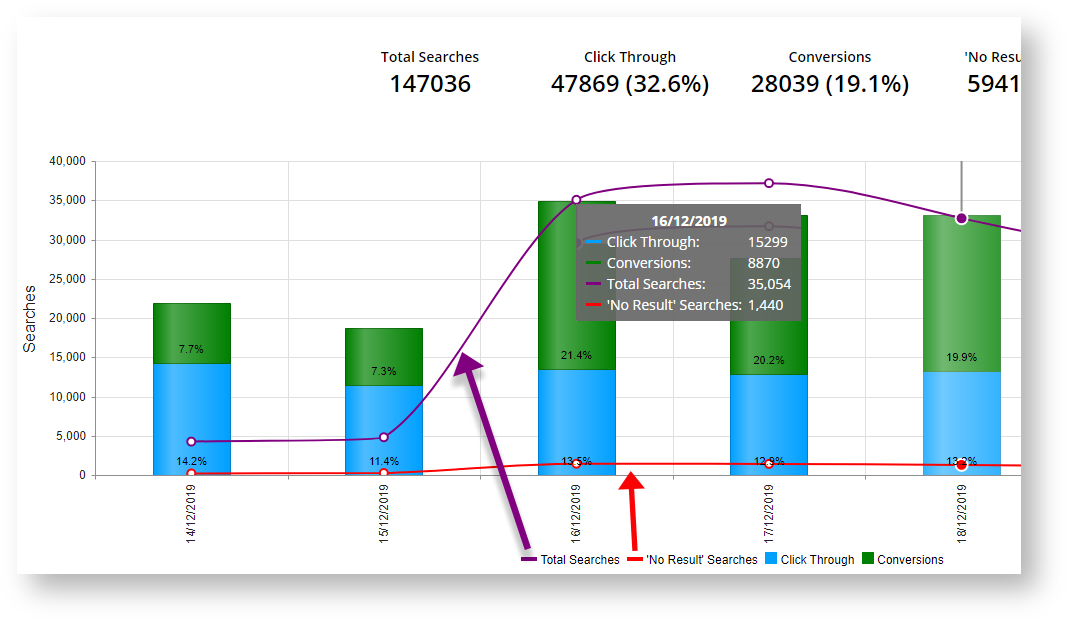
Legend Total Searches
'No Result' Searches
Click Through
Conversions
Total Searches and 'No Result' searches correspond to the purple and red lines respectively that intersect the Click Through and Conversions value bars.
Toggle each value off/on to hide or show that feature on the graph.
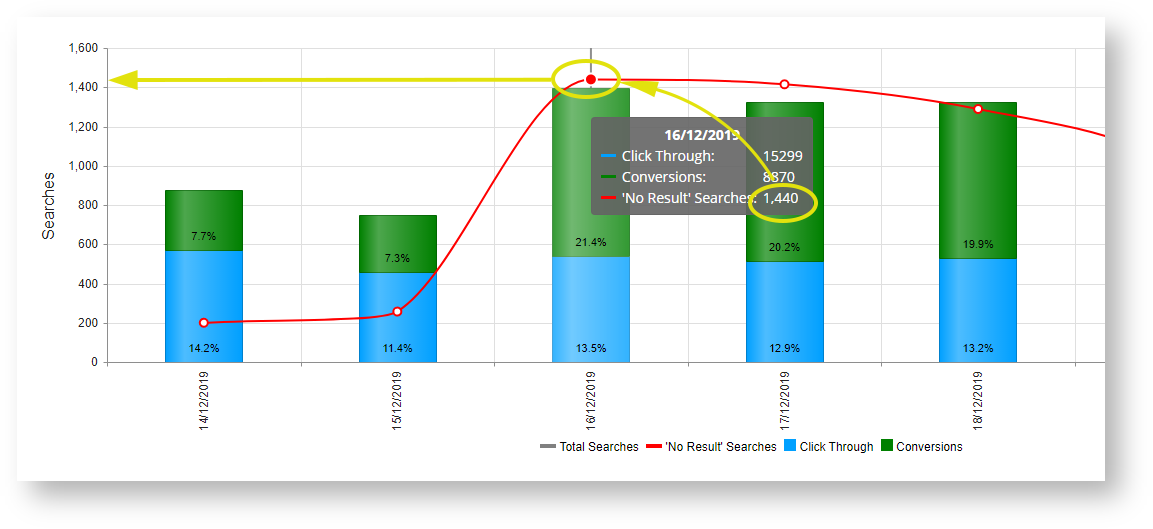
Y-Axis Searches The Y-axis measures the Total Searches and 'No Result' Searches data.
Untick Total Searches (purple dash in the legend) and notice the y-axis values adjust to that of the 'No Results' Searches data.
'No Results' Searches measures the number of times a user typed in a search term that yielded no results.
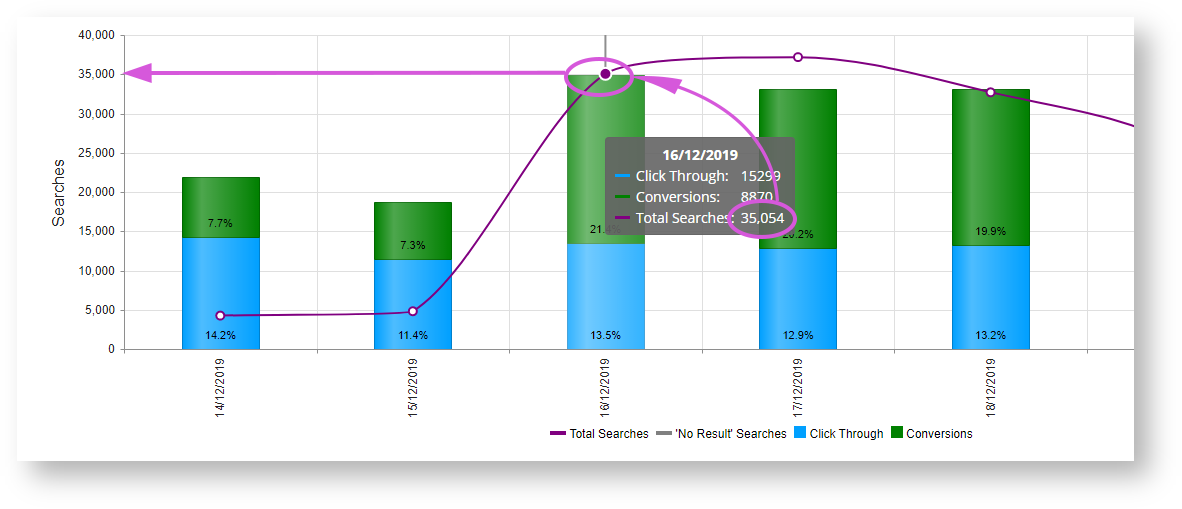
Tick Total Searches and untick 'No Results' Searches.
Notice how the y-axis figures change.
Total Searches measures the all searches users entered irrespective of their success.
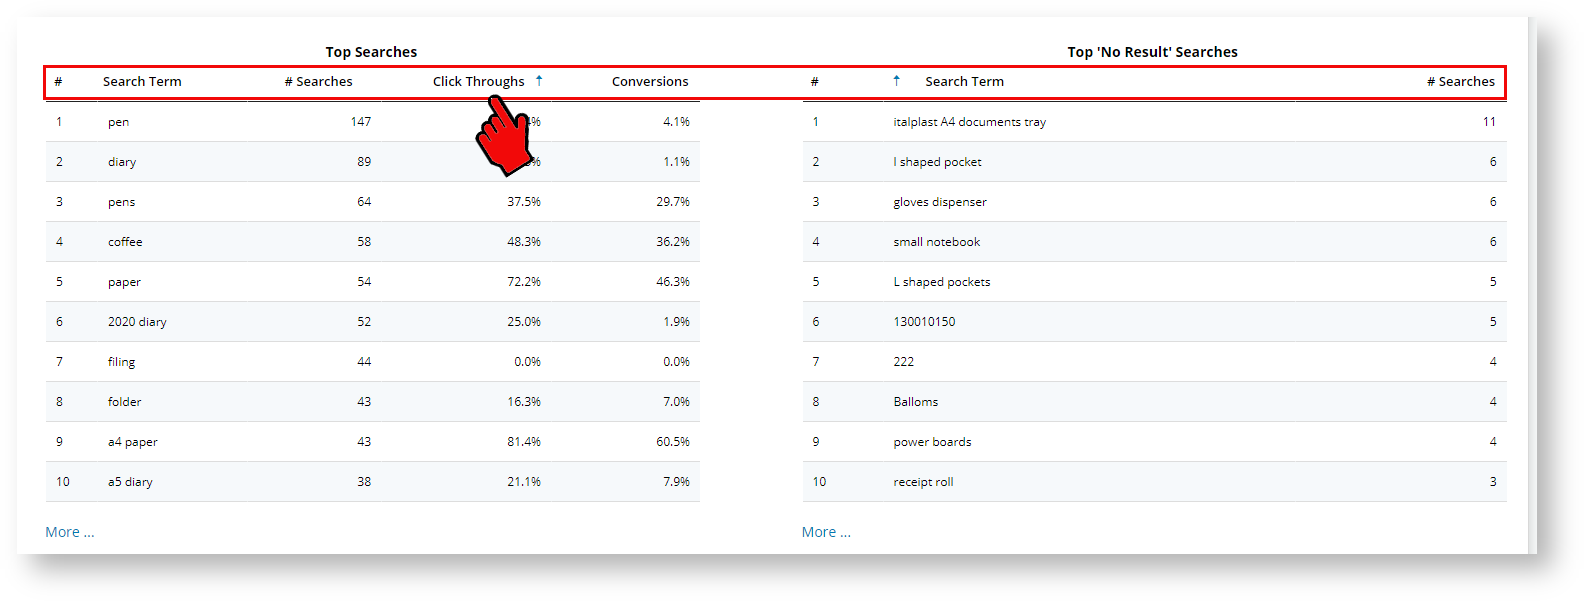
Top Search Grids Highest # Searches Click any of the headings in the Search Grids to sort the data by that parameter.
The system will display an up or down blue arrow next to the column heading for which the data is sorted.
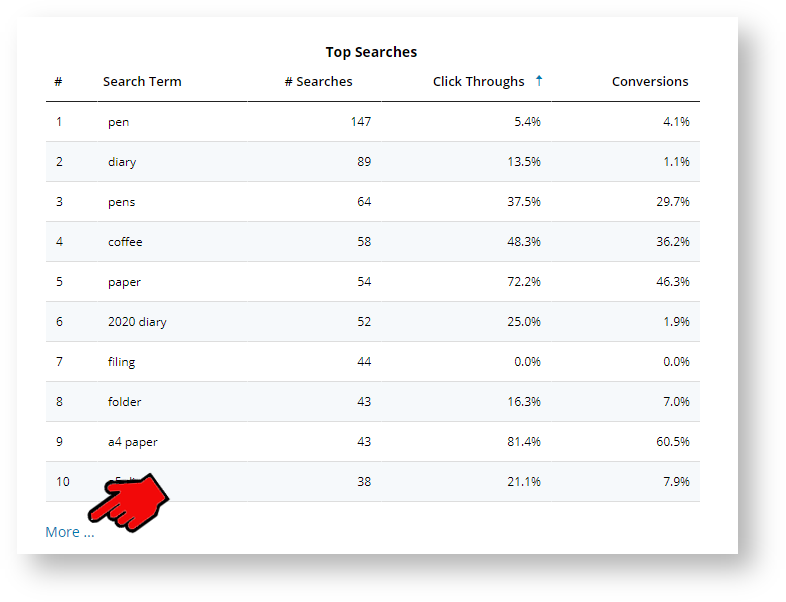
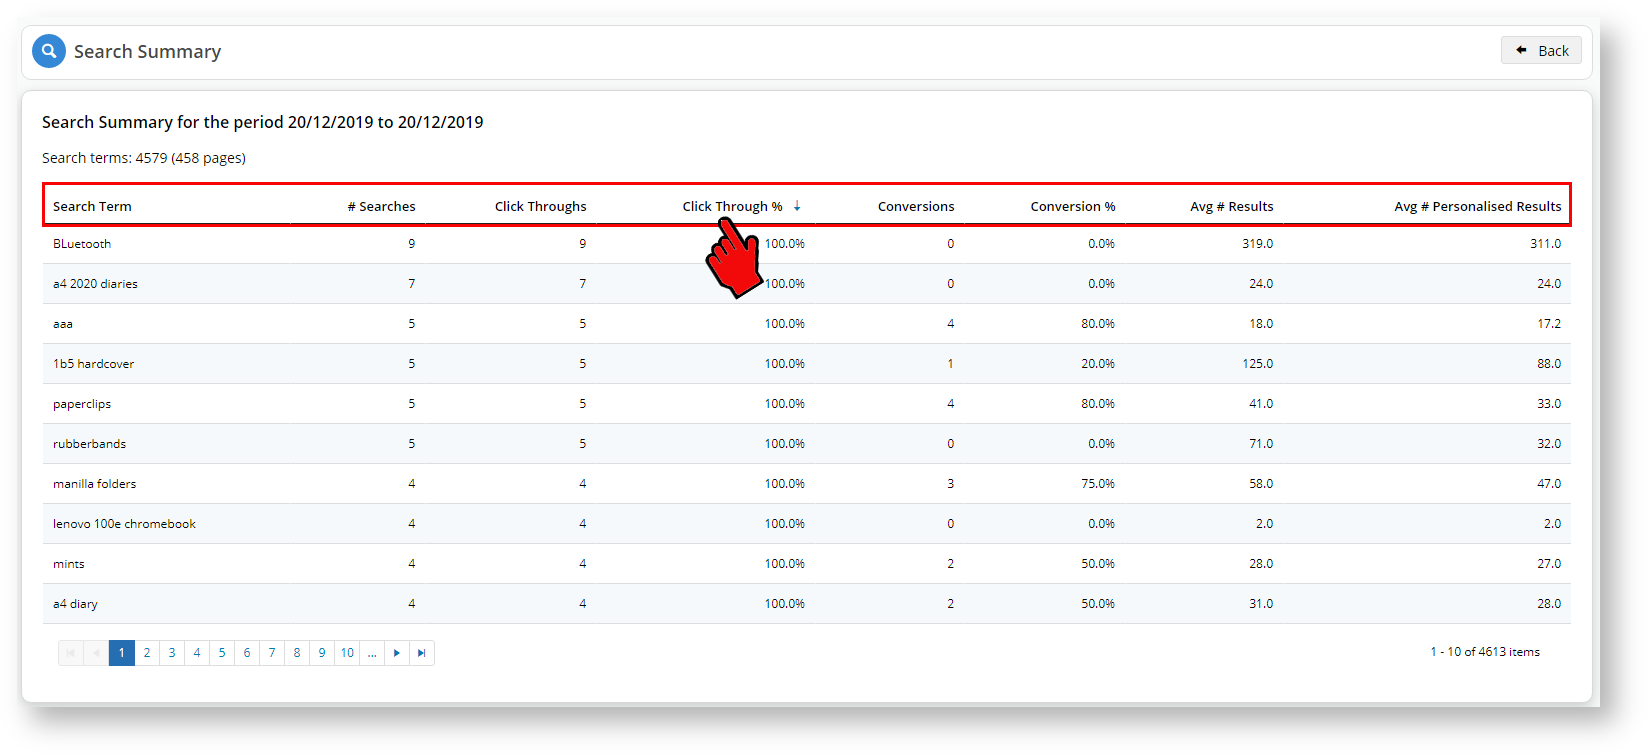
Top Searches More... Click the More... indicator to display more information on customer's search terms.
Similar to the Top Searches grid, you can click on any of the headings to sort the data.

Additional Information
| Multiexcerpt | ||
|---|---|---|
| ||
| Minimum Version Requirements |
| |||||
|---|---|---|---|---|---|---|
| Prerequisites |
| |||||
| Self Configurable |
| |||||
| Business Function |
| |||||
| BPD Only? |
| |||||
| B2B/B2C/Both |
| |||||
| Ballpark Hours From CV (if opting for CV to complete self config component) |
| |||||
| Ballpark Hours From CV (in addition to any self config required) |
| |||||
| Third Party Costs |
| |||||
| CMS Category |
|
Related articles
| Content by Label | ||||||||||||||||||
|---|---|---|---|---|---|---|---|---|---|---|---|---|---|---|---|---|---|---|
|
...